Small Business Analytics Dashboard: 7 Metrics Every Owner Should Track

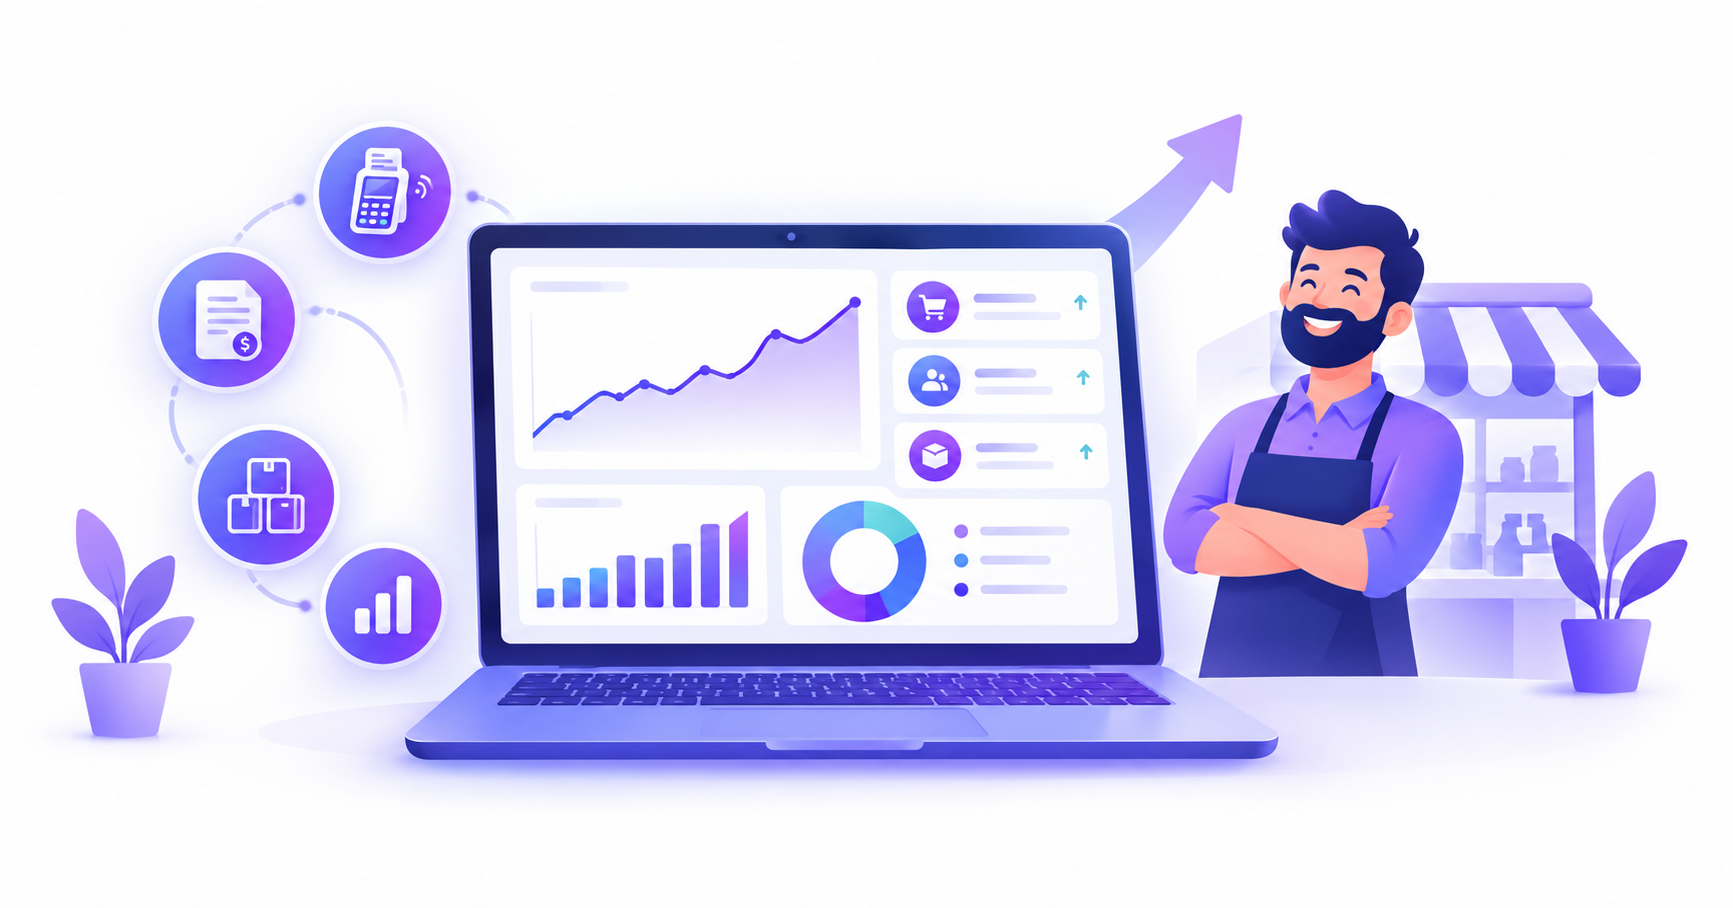
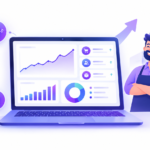
A small business analytics dashboard shows your key numbers in one view. The seven metrics to track are revenue, number of sales, average sale value, best-selling products, stock levels, outstanding invoices and sales by time of day.
Most owners know whether the month “felt good.” Fewer know exactly why. An analytics dashboard answers that without hours in spreadsheets.
1. Total revenue
Track daily, weekly and monthly revenue. Compare against the same period before to see real growth.
2. Number of sales (transactions)
Revenue can rise because you sold more, or because prices changed. Transaction count shows which.
3. Average sale value
Total revenue divided by number of sales. If it grows, customers are spending more per visit. Bundles and upsells can lift it.
4. Best-selling products
Know your top items so you never run out of them, and feature them in promotions.
5. Stock levels and slow movers
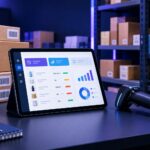
Pair sales data with inventory. Items that sit unsold tie up cash. Items about to run out cost you sales.
6. Outstanding invoices
Unpaid invoices are money you’ve earned but don’t have. Track what is overdue and follow up early.
7. Sales by day and hour
Find your busiest and quietest times so you can schedule staff and run offers when traffic is low.
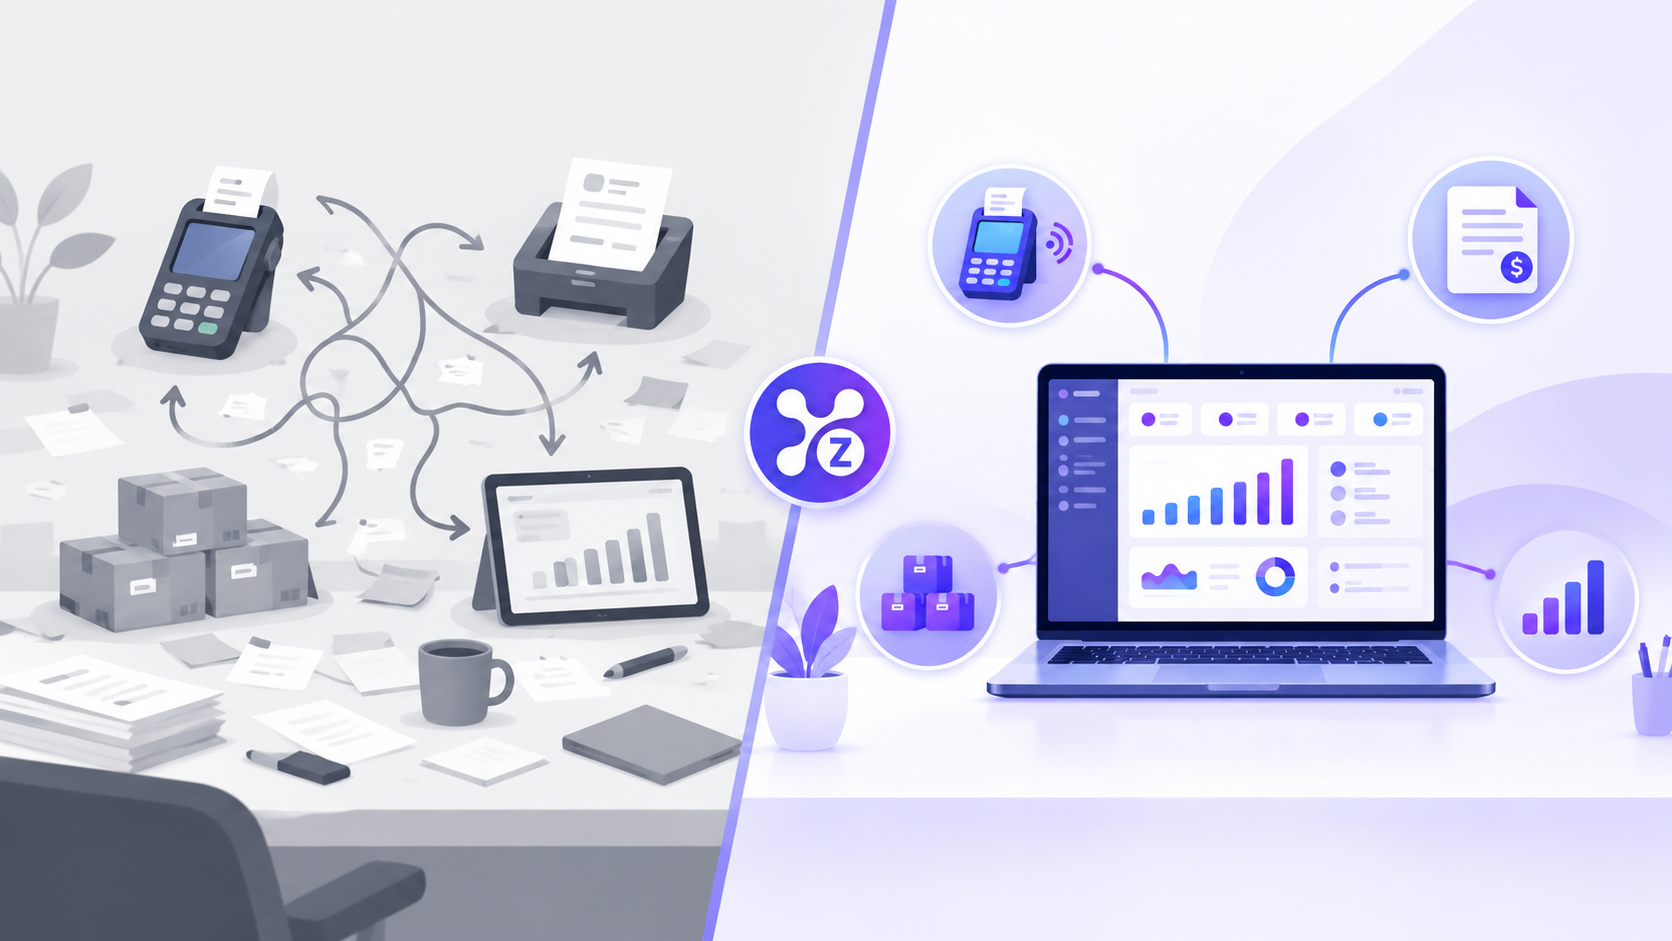
Why this works best in one system
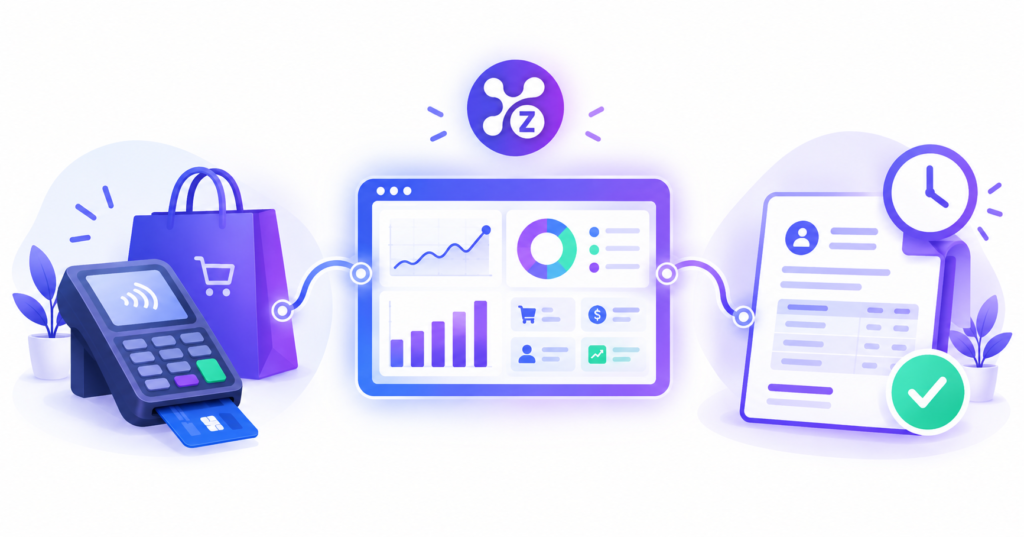
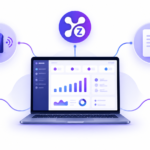
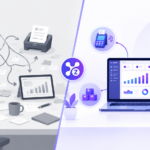
Analytics are only as good as the data behind them. When POS, invoicing and inventory feed the same dashboard, these seven metrics update automatically and never disagree with each other.
How to use your dashboard weekly
- Check revenue and transactions against last week.
- Review best sellers and low stock, then reorder.
- Follow up on overdue invoices.
- Adjust staffing or promotions based on busy and quiet hours.
Fifteen minutes a week is enough to catch most problems early.
Analytics with Zollva
Zollva puts POS, invoicing, inventory and analytics in a single dashboard, so your reports are built from live business data.
Start tracking smarter: Explore Zolva. For more practical advice, read our guides to inventory management software and all-in-one business software.
FAQ
What is a small business analytics dashboard? It is a single screen that displays your key sales, stock and invoice numbers so you can make decisions quickly.
What metrics should a small business track? At minimum: revenue, transactions, average sale value, best sellers, stock levels, outstanding invoices and peak sales times.
Do I need a data analyst to use one? No. Modern dashboards present charts and totals automatically from your daily sales.
How often should I review business analytics? A quick weekly review works for most small businesses, with a glance at daily sales as needed.

Pingback: POS vs Invoicing Software: Which Does Your Business Need?